

Hardware components | ||||||
 |
| × | 1 | |||
 |
| × | 1 | |||
Software apps and online services | ||||||
| ||||||
 |
| |||||
 |
| |||||
| ||||||
| ||||||
| ||||||
Rockfalls are shown to be a serious threat to railways, highways, and roads, more so in mountain areas, seeing as they go often undetected until it is too late for authorities to respond - traffic may already be disrupted, or worse, lives may have been lost. Studies show that a significant number of accidents and fatalities have been caused by unexpected rockfalls - that's why we made it our mission to find a way to minimize or even prevent accidents like this from happening.
🪨 RockyTracker - Staying Ahead Of The SlideRockyTracker is a real-time hazard detection system that is designed to monitor rockfalls across roads and railroads in Slovenia. By combining simple hardware with a cloud infrastructure, we created a system that can be used as a base for further developing a detailed interactive tool for helping people in their everyday lives.
Users can visit the websiteRockyTracker, where they are presented with an interactive map featuring markers and the option to subscribe for real-time alerts. An additional feature provided by the website is access to the full history of all devices currently active and located in Slovenia. This makes RockyTracker not only useful to everyday commuters, but also to researchers, engineers or even infrastructure planners, who can use it as a practical tool in their work.
💡Why Use RockyTracker?RockyTracker is built on a simple concept, using audio-based detection to identify rockfalls of varying sizes and notify users in real time. Our goal was to create an accessible and low-cost platform that provides safety information for both the public and professionals.
Powered by the LoRaWAN XIAO nRF52 Sense, each device listens for characteristic rockfall sounds and with the help of our model that was trained using Edge Impulse and tested on an Arduino Nano BLE 33 as well as the XIAO nRF52 Sense, sends hazard events wirelessly to the TTN servers, where we take the information to our cloud system. The platform enables users to:
↪ Detect rockfalls using a XIAO nRF52 Sense microphone feature
↪ Receive notifications for any upcoming device activity and show users their nearby devices from where they are viewing the website using geolocation API's
↪ Visualize hazard activity live on an interactive map with the option to see threat levels, devices that are located on roads, railroads or both as well as number of activities detected on each device.
⚙️How It Works?Users can view the interactive map on RockyTracker without any sign-up required, where they can:
↪ View all the locations of the devices that are communicating with the website's backend using LoRaWAN gateways and TTN.
↪ Easily differentiate the hazard level of the location where the device is located with the use of a color coated marker legend.
↪ See the last documented rockfall on the selected device, when it was detected, ID of the device, size of the rocks as well as how many reports there have been on that site
↪ Subscribe to receive live updates for new device inputs and show devices that are within ~ 25 km while being able to unsubscribe at any time
🧠Machine learning using Edge ImpulseWe used Edge Impulse to develop our ML model. It is very beginner-friendly due to its extensive documentation, but it also supports advanced model development by allowing customization of many parameters.
For rock detection and classification, we use a microphone integrated on the chip. Initially, we tested on the Arduino Nano 33 BLE board, and the implementation is now running on the XIAO nRF52 Sense.
Currently, our dataset consists of sound effects and YouTube videos of rocks, but we plan to collect our own data to improve the ML model. We split the dataset into training (87%) and testing (13%) sets.
The model classifies audio into three categories: Noise, Small Rocks, and Big Rocks, using the MFE (Mel-filterbank energy) processing block. The model listens for 0.1 second, with a sampling rate of 16 kHz. For MFE, the only change we made was reducing the number of filters to 20.
We did not modify any parameters in the neural network, as we already achieved an accuracy of 94.4%.
Arduino sketch is designed to:
↪ Record audio using the onboard microphone.
↪ Run Edge Impulse ML classification to detect the size of rocks (e.g., small or big).
↪ Track battery level via an analog pin.
↪ Send the classification result and battery status wirelessly using LoRaWAN.
⭐Main Features
↪ Audio Collection and ML Inference
⇢ Uses Edge Impulse's machine learning model to analyze audio input.
⇢ Captures sound from the microphone using the PDM interface.
⇢ Processes the sound in real-time to classify between:
▹ 0 → Small rock
▹ 1 → Big rock
Applies a majority voting mechanism over a 10-second window to reduce false positives.
↪ LoRaWAN Communication
⇢ Initializes LoRaWAN settings (AppEUI, DevEUI, AppKey).
⇢ Joins the LoRaWAN network using OTAA mode.
⇢ Sends a message only if the classification result changes.
⇢ Sends the following message:
AT+MSG="id=<device_id>,size=<0 or 1>,battery=<battery_percentage>"↪ Battery Monitoring
⇢ Reads battery level from analog pin A0.
⇢ Converts the analog value into a percentage.
⇢ Sends battery updates every 20 seconds (default, for testing).
↪ Device Identification
Uses part of the unique MCU ID to identify the device
NRF_FICR->DEVICEID[0]Converts the 32-bit ID into a shorter, readable numeric ID (% 10000000) to reduce message length.
🗂️Classification Logic
↪ Only proceeds with classification if confidence for class 1 (anomaly) is low.
↪ Classifies sound as:
⇢ Small Rock (0): If the "small" class is more likely.
⇢ Big Rock (1): If the "big" class dominates within the 5-second period and occurs at least threshold times (default = 5).
🔁Loop Summary
↪ Reads battery percentage.
↪ Records audio slice.
↪ Runs classification.
↪ Tracks recent classifications.
↪ Every 10 seconds:
▹ Decides the dominant result.
▹ Sends classification and battery status if the result has change
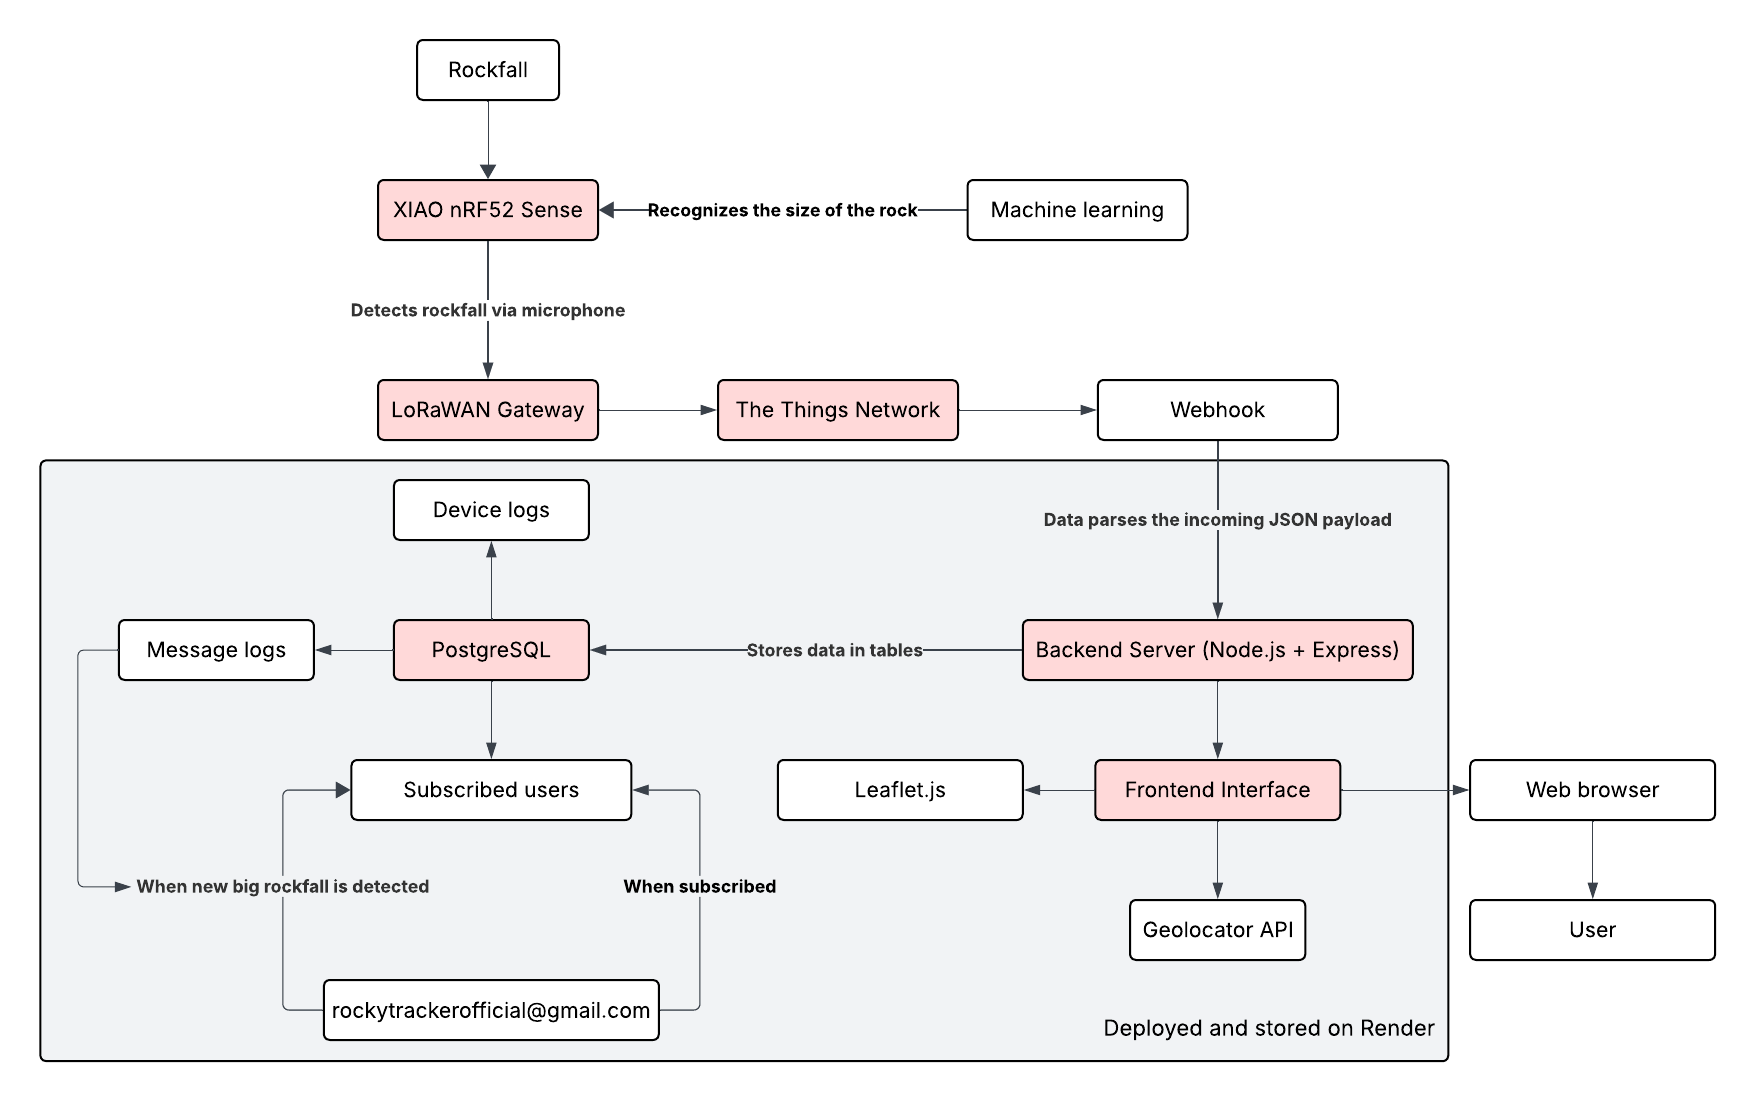
💻Connection and website developmentThe functionality of the website depends on the hardware to backend connection, hence reading and using the data is one of the main features. We gather this data via The Things Network, where the device sends information that we read as a JSON payload through a webhook connected to one of our backend routes. From this payload, we extract the following parameters:
↪ Size of detected rocks
↪ Latitude & Longitude
↪ Timestamp
↪ Device ID
↪ Battery percentage
Once received by the backend, the data is processed and stored in a PostgreSQL database. The website developed using Node.js, the framework Express.js, and the Leaflet.js library, fetches this data and displays it on an interactive map. Users can visit the site without logging in, see active sensor locations, event severity, and subscribe to receive real-time alerts.
The parameters stored in the database (hosted on Render) will further be used to display the markers on the website. With the custom hazard levels, we display color-coded markers based on the number of detected rockfalls. For example, if four rockfalls occur in Maribor, the marker will be classified as level 2 and display the corresponding color.
We also integrated the Geolocation API so the system can show users nearby devices automatically, making the experience personal. The entire stack is deployed on Renderensuring that data flows continuously from device to browser in near real-time.
Regarding the database, our website focuses on having organized tables, for subscribed members, registered devices, and message logs tracking all device activities. The emails are sent from our official Gmail account rockytrackerofficial@gmail.com, where the user receives a welcome email, the option to unsubscribe from the newsletter, as well as update-emails for all rockfalls detected that are large in size.
🗺️Map-Centric Design Focused on Slovenia
The central element of the UI is an interactive map, made with Leaflet.js, specifically focused on the geographic area of Slovenia. This decision reflects the scope of our deployment, as all current and planned sensor installations are located throughout Slovenian infrastructure - particularly landslide-prone regions.
🧩Minimalist Layout with Essential Features
To avoid overwhelming users with unnecessary information, the layout has been kept clean and minimal. The main components of the interface include:
↪ Interactive Map View: Displays markers representing individual sensors or detected rockfall events. These markers are color-coded based on how frequently rockfalls have occurred in that location historically.
↪ Legend Panel: A simple but essential part of the UI, the legend explains the meaning of each marker color. This allows users to quickly assess risk levels based on visual cues alone.
↪ Filter Options: Users can toggle between viewing rockfall data from roadside sensors, railway sensors, or both. This enables targeted analysis, particularly useful for transportation planners or maintenance crews focused on a specific type of infrastructure.
📍Markers & Geolocator
The markers are reading the data directly from the database, ensuring they update simultaneously for any connected LoRaWAN device. When clicked they show the device ID, device name, longitude, latitude, number of detected rockfalls as well as last time a rockfall has been detected. For animation purposes we used different CSS effects to make the interaction more seamless. Additionally, we added the Geolocator feature, displaying a bright teal color that easily shows where the user is located currently.
📯User Interaction & Alerts
At the bottom of the screen, users will find a subscription panel that opens as a popup. Here, they can subscribe to a notification service by entering their email address. Once subscribed, the system will automatically send an email alert whenever a rockfall is detected near their location, helping them stay informed and safe.
🔍Info panel
On the right side of the website there is displayed a simple info panel with short a description regarding the website, the demo video, link to Hackster as well as the LinkedIn profiles of our teammates, all with the intent of allowing the user to easily inform themselves if needed.
Regarding future improvements, we aim to develop a more robust audio detection system that can accurately distinguish between small and large rockfalls. Additionally, we plan to implement a feature that indicates whether roads or railways are blocked, specifying whether the obstruction is caused by small rocks or large rocks.
We would also like to build an SMS notification system, or a mobile app, that sends alerts to users near a hazard who may not be aware of it.
On the hardware side, our focus will be on improving the devices' battery life, potentially incorporating alternative power sources. We also want the devices to go offline or signal their status when they run out of power.
💭About usThis project was created as part of the course MIS – Mobility and Internet of Things at the University of Ljubljana, Faculty of Electrical Engineering.
We are truly grateful for the opportunity to combine hardware, machine learning, full-stack development, and user experience to create something we can share with other talented engineers and enthusiasts.
If you have any questions, feel free to contact us at rockytrackerofficial@gmail.com or reach out to the team members individually 😊!


Comments