


Hardware components | ||||||
 |
| × | 1 | |||
 |
| × | 1 | |||
 |
| × | 1 | |||
 |
| × | 1 | |||
In this project, I will guide you through setting up an IoT server on a Raspberry Pi or in your preffered device with the open-source tools Prometheus and Grafana.
The Prometheus server will collect data from an ESP8266 or ESP32 device running a customized Tasmota firmware configured to expose metrics (Temperature and Humidity) compatible with Prometheus.
With Grafana, you’ll be able to visualize Graphically the data such as temperature, humidity, and other Tasmota metrics exposed.
Prometheus and Grafana provides a comprehensive solution for IoT data collection and visualization.
NOTE: This project does not require MQTT, Node-red, InfluxDb, it only requires your IOT device ESP8266 or ESP32 flashed with a customized Tasmota firmware version and Prometheus and Grafana.
This setup is quite unique as most of the instructions and videos available to achieve the same visualization solution requires MQTT, Node-red and other time series database.
So, watch the video and follow these instructions to achieve the same results. I hope you enjoy this project!
Installation of Prometheus and GrafanaPrometheus and Grafana can be installed on virtually any operating system or hardware. For this guide, I installed them on a Raspberry Pi. The Raspberry Pi is a great option because it’s lightweight, energy-efficient, and convenient to keep running 24/7 in your home.
However, you are not limited to using a Raspberry Pi. These tools can also be installed on a notebook or desktop running Linux, Windows, or macOS. Alternatively, you can install them using Docker, which I demonstrate in the accompanying video. While Docker simplifies the initial installation process, it may introduce complexity when managing files, as you need to map or mount directories from your system to the Docker container.
Choose the setup that best fits your environment and use case.
Install Prometheus: Follow this guideline in case of raspberry-pi installation: https://pimylifeup.com/raspberry-pi-prometheus/ - You can also search for installation of instructions of Prometheus in official page (https://prometheus.io/) or even on chatgpt.
With Prometheus running, access its web interface by opening a browser and navigating to:
http://<your-pi-ip>:9090Install Grafana: Check Grafana official page to install Grafana in any system or follow the instructions below to install in a Raspberry-pi
To install Grafana on your Raspberry Pi. Open the terminal and type:
wget -q -O - https://packages.grafana.com/gpg.key | sudo apt-key add -

echo 'deb https://packages.grafana.com/oss/deb stable main' | sudo tee /etc/apt/sources.list.d/grafana.list

sudo apt update
sudo apt install grafana
Once installed, start the Grafana service with:
sudo systemctl start grafana-server
sudo systemctl enable grafana-server
This ensures Grafana starts automatically when your Raspberry Pi boots.
With Grafana running, access its web interface by opening a browser and navigating to:
http://<your-pi-ip>:3000Log in with the default credentials: username admin and password admin. You’ll be prompted to set a new password for security.
ESP8266 Flashed With Customized Tasmota for PrometheusPrometheus is a powerful monitoring system designed to handle data in two primary ways:
- Scraping (Pull Model): Prometheus actively retrieves data from a node, system, or device that exposes metrics via a /metrics endpoint on a web server.
- Ingesting (Push Model): Prometheus also supports pushing data into its database using its REST API, typically through intermediary tools like Pushgateway.
In this project, we’ll use the scraping approach. The ESP8266 or ESP32 microcontroller will expose a REST endpoint named /metrics containing the data we want to monitor. We will configure Prometheus to scrape this endpoint at regular intervals, collecting the data and storing it in its time-series database.
Once Prometheus is set up and scraping data successfully, we’ll integrate Grafana, a powerful visualization tool. Grafana will connect to the Prometheus database, retrieve the stored metrics, and display them on dynamic dashboards. This setup will provide us with a comprehensive monitoring system, ideal for IoT projects.
Key Benefits of This Setup:- Scalability: Prometheus can handle multiple devices and endpoints, making it ideal for projects with several IoT nodes.
- Visualization: Grafana offers highly customizable dashboards, enabling us to analyze trends and monitor the health of our system in real time.
- Open Source: Both Prometheus and Grafana are free and widely supported by an active community, ensuring flexibility and longevity for your projects.
Now that you understand the overall architecture and benefits, let’s dive in and start building our monitoring and visualization system!
So, how ESP8266 can expose the metrics from the sensor that you are using, in our case the BPM280 that reads Temperature and Pressure?
Fist, you need to compile your version of Tasmota, but do not worry, if you never did it, it is more simple that you think, all over the web browser! This is because you can access for free the Tasmota project on GitPod, you just need to create an account in Github and then you have already the project setup for you, you will only need to enable one flag in the code, give the command to compile and then download your customized compiled version.
Simplest way to compile is with GitPod, requires only a web browser.
- Click here: Master Release: https://gitpod.io#https://github.com/arendst/Tasmota/tree/master
- Access the project, you need to have GitHub account, if not create a new one.
- After you get access to the project, find the file /tasmota/my_user_config.h
- Search for the word Prometheus and you will find the line below
// #define USE_PROMETHEUS
- Uncomment it like below:
#define USE_PROMETHEUS
Note: if you want to use a temperature and pressure sensor like BPM280 you also need to enable its flag (#define USE_BMP // [I2cDriver10] Enable), search for BPM and uncomment it as well. If you are using DHT11 you do not need to change anything else besides USE_PROMETHEUS.
- Compile now the project by typing this command in the web shell at the botton of the webpage:
platformio run -e tasmota
After compilation is finished you can download the tasmota.bin.gz in the folder, by right clicking and click on download option:
/build_output/firmware/tasmota.bin.gz
- Download it to flash your ESP8266 with this new compiled tasmota firmware that has USE_PROMETHEUS enabled.
OTA (Over-The-Air) Flash
If you already have Tasmota flashed on your device, you can use the File Upload OTA method to load the new firmware binary file
- Download tasmota-minimal.bin.gz
- Make a backup of the device configuration using the web UI Configuration menu option.
- Upload tasmota-minimal.bin.gz to your device using the web UI Firmware Upgrade selection. Choose Upgrade by file upload.
- After tasmota-minimal.bin.gz is successfully loaded, select Firmware Upgrade once again and upload the firmware file compiled using Gitpod, from previous step.
Step 1-3 only applies to ESP8266, where you should use the.bin.gz file for upgrades.
Check this page If you find any issue or instructions above are not clear. In case you do not have Tasmota yet installed, check carefully this page from Tasmota Getting Started! Attention to hardware preparation on the first installation.
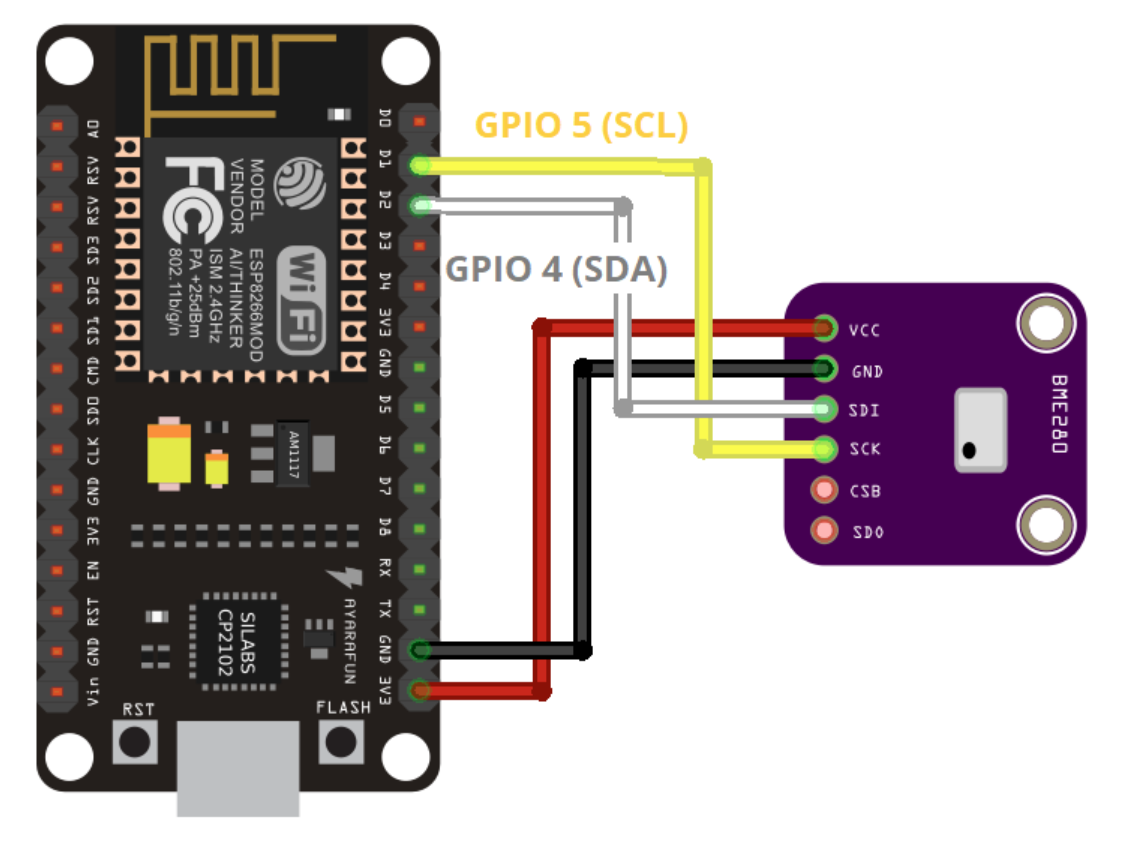
Configure Your Tasmota Device and Wireup Your SensorAdd your DHT11 or BMP280 sensor in you ESP device. Note, to use BMP280 in Tasmota, you also need to enable the flag of it and compile it.
Configure the Tasmota GPIO to receive the sensor data. As I was using BPM280 and it uses I2C to transmit the data, I used the PIs GPIO4 and GPIO5 configured as below:
Then in the main screen of tasmota you should be able to see the data from sensor BMP or BME280 already working:
BMP280 Temperature    28.6 oC
BMP280 Pressure 942.8 hPaTake note of the IP that your Tasmota device is using, if you do not find it, check on your router or install a app called Fing in your mobile to search of it. If possible fix the IP assigned to your Tasmota with the Tasmota MAC Address in your router, in this way it will never change. Or define a hostname and create a internal DNS server in your raspberry-pi or computer.
Test now the metrics endpoint by accessing: (NOTE: This is the key point of this project, if your sensor data is exposed in the <tasmota-ip>/metrics endpoint, you have everything in place to setup Prometheus to scrape it and then Grafana to receive data from Prometheus. Check in your browser this endpoint:
http://<tasmota-ip>/metricsIf you receive a data like in the image below, you are good to continue and configure Prometheus.
Now your ESP8266 will continue webserving the data on this /metrics endpoint and we need to configure Prometheus now to scrape or pull the data from this endpoint. By scrapping it, Prometheus will store the data on its timeseries database and Grafana should be configure to have Prometheus as a datasource, in this way you can create Grafana Dashboards that has access to your Prometheus source that has your ESP data and the end-to-end is completed.
Configuration of PrometheusJust update the file prometheus.yml with a new entry of scrape_configs: like in the image.
The target IP or hostname should be related to the IP of your ESP8266 Tasmota IP. You also should define a job_name, in this case I defined esp8266_dht11 (later I changed my sensor to BPM280).
Note: your Prometheus server should be in the same network as your Tasmota or your tasmota IP should be reacheable by your prometheus server.
In my prometheus.yml as example below I added my tasmota IP that was : 192.168.0.161
After adding it, save and close the prometheus.yml file and restart your Prometheus server.
As I was using docker to run my prometheus server I did a docker stop prometheus and then a docker start prometheus. But it depends on how have you installed the prometheus.
After that enter in your prometheus dashboard :
http://<your-pi-ip>:9090And check your targets, the new entry should be UP and shown in image below.
If State of your tasmota metrics is UP everything is fine and you can use Grafana to visualize the data now. Let´s go for the last step!
Configuration of GrafanaAdd prometheus as data source.
Configure similar as below, of course use your own IPs or domain names.
Save and Test it. Now you can create and configure the dashboard to show the sensor data graphically.
Grafana DashboardConfigure the dashboard by creating a new one as steps shown in the image.
For instance click on create a new dashboard, add a visualization panel and a page like below will shown. Follow the steps:
Add a visualization panel and choose the metric below: (check your http://<tasmota-ip>/metrics to choose the correct metric depending on your sensor, I was using BMP280.
tasmota_global_temperature_celsiusRun the metric, add unit, title and save the Dashboard.
Repeat the process to create another visualization for other metrics.
Add another visualization for other metric.
Add a visualization panel and choose the metric below (if using sensor BPM280).
tasmota_global_pressure_hpaRun the metric, add unit, title and save the Dashboard.
For these two metrics you should see a dashboard like below: Note that my sensors were running for more than one day, that is why it I showing many points in the graph. You can also try another type of graphs as well.
Like this one:
I will provide soon a video showing all of these steps in my youtube channel called Electrofun, consider to subscribe!
If you have any comments or suggestions fell free to contribute, cheers!


_3u05Tpwasz.png?auto=compress%2Cformat&w=40&h=40&fit=fillmax&bg=fff&dpr=2)
Comments