
Hardware components | ||||||
 |
| × | 1 | |||
| × | 1 | ||||
 |
| × | 1 | |||
Software apps and online services | ||||||
 |
| |||||
This project is made as a part of Bolt IoT training. Objective of the project is as follows:
- Make sure the temperature of the refrigerator is between the boundaries set by us every 10s. If not send an alert to the user.
- To send an alert if someone opens the refrigerator door using Z - Score analysis.
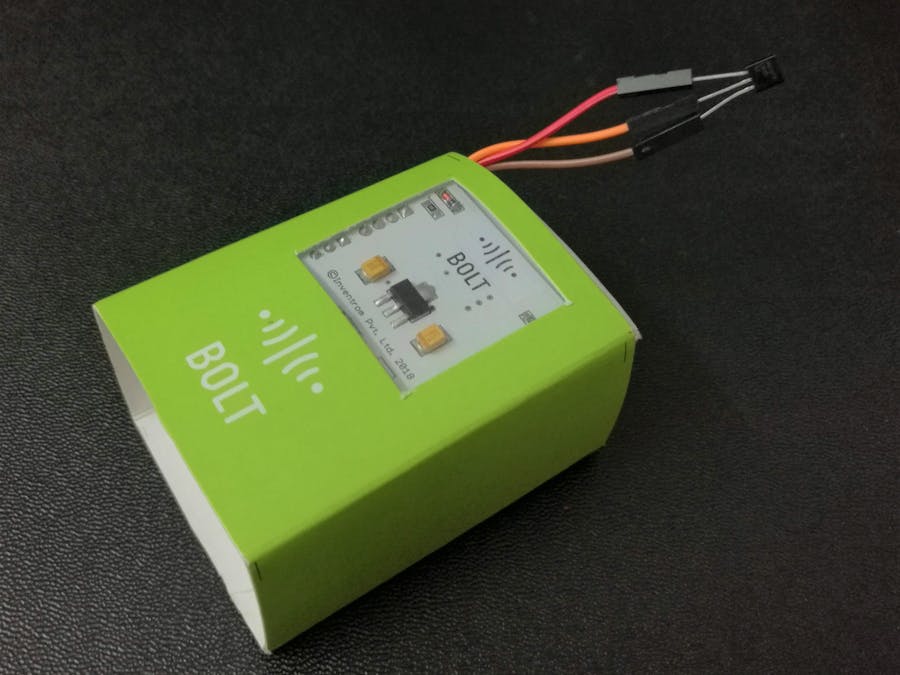
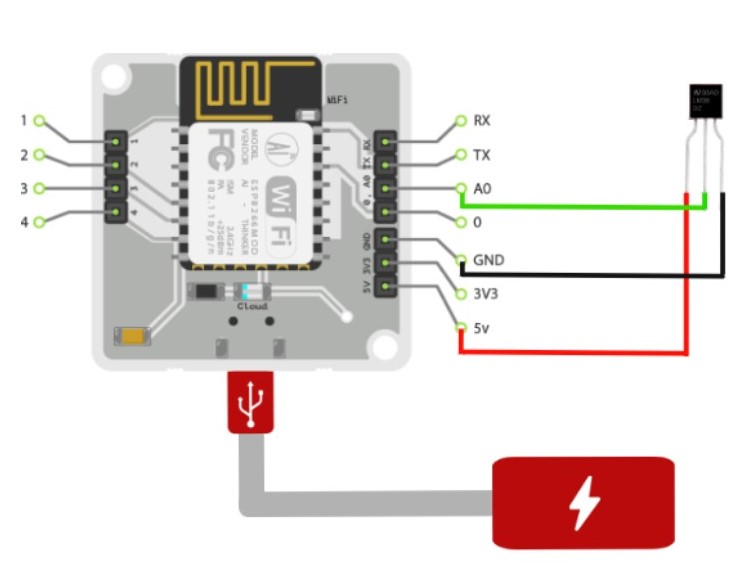
This is the circuit design. The power source can be a powerbank which is sufficient to power the Bolt WiFi module. Use the jumper cables to connect the LM35 IC to the Bolt WiFi module. It will look something like below:
First, make sure that your Bolt WiFi Module is connected to Bolt Cloud and the green LED onBolt Moduleis Glowing. If not then follow the steps in this project to setup the device: Setting Up the Bolt WiFi Module.
Step 1 : Finding the boundaries
Just follow these steps :
1. Login into cloud.boltiot.com and click on the 'Product' tab.
2. Click on Add Product and give a suitable name for your product. Select output devices and GPIO. Then click on 'Done'
3. Click on Configure this product to configure the product.
4. Click on the "A0" pin of the Bolt and give it a name (say temp) in the right side naming section. Finally, click on the "Save" icon to save your change and wait for the page to reload.
5. Click on Code section. Give a file name and select js (Javascript) as file extension.
On the left side we type the code :
setChartLibrary('google-chart');
setChartTitle('Polynomial Regression');
setChartType('predictionGraph');
setAxisName('time_stamp','temp');
mul(0.0977);
plotChart('time_stamp','temp')
- setChartLibrary function is used to specify the library to use while plotting the data. Using 'google-chart' we can easily plot variety of charts like line graph, bar graph, scatter plot, gauge graph etc with a single line of code.
- setChartTitle simply sets a title for our chart. This title will be displayed above the plotted graph.
- setChartType is used to specify the type of graphical representation for visualizing our data. We use 'predictionGraph' which can predict future values using Polynomial Regression Machine Learning technique.
- setAxisName function is used assign certain names to parameters in X and Y axes to be plotted. We give Time for X-Axis and Temperature for Y-Axis.
- mul function multiplies certain constant with the sensor value. Here, to calculate temperature from sensor value, we have the formula: T = (100 * sensor_value) / 1024 or T = sensor_value * 0.09765. So we use 0.0976 with mul function here.
- plotChart is the function that plots the graph with specified variables on the output screen.
6. Finally, click on the "Save" icon to save the changes to the product.
7. Now we have to link our bolt device to this product. To do that click on link icon, choose the required bolt device and hit 'Done'.
8. Now, we need to deploy the code to the Bolt device. Deploying will transfer the code and configuration to the Bolt device.
9. We place our circuit inside the fridge and see the temperature by clicking on the "Computer Monitor" icon on your Bolt device.
This will open up a new page which will have a graph. Every 5 minutes, the Bolt will send a temperature reading to the Bolt Cloud.
Keep taking the reading for atleast 2hrs to find the optimum boundary temperatures.
After 2hrs check the graph and select the boundaries.Now that we have our boundaries fixed, let’s move on and use it in our program.
Step 2: The Actual Program
Here I am using MailGun to send alert as e-mail to my mail address. Use this link for setting up mailigun. So make sure you have the the mailgun api key and sandbox url. These are required to send the alert.
The main code can be divided into two parts.
First part consists of checking whether the sensor value that we got present is between the boundaries that we have set. If not a mail will be send alerting the user. The code looks like this :
Second part is the Z Score analysis of the temperature to check for sudden anomalies, like opening the fridge. For Z score analysis to work perfectly, you have to set the frame size and multiplication factor so that anomaly detection can work flawlessly. The code looks like this :
So initially the program checks if the temperature is within the boundary that we have set. If not it will show like this :
Also a mail will be sent to the user like this:
For Z-score analysis, it initially will not look for anomalies until some readings are taken. The number of readings that has to taken depends on the frame size that you set. When an anomaly (like opening the fridge), a mail is sent to the user.
Conclusion
So this is the Temperature Monitoring System using BOLT IoT. This project has a wide variety of applications in real life scenarios. The training was a real eye opener that made me realize the true potential of Internet Of Things. Hope everyone that go through this project will enjoy building this.
Peace ✌️

Comments