


Hardware components | ||||||
 |
| × | 3 | |||
 |
| × | 1 | |||
 |
| × | 7 | |||
 |
| × | 3 | |||
 |
| × | 3 | |||
Software apps and online services | ||||||
 |
| |||||
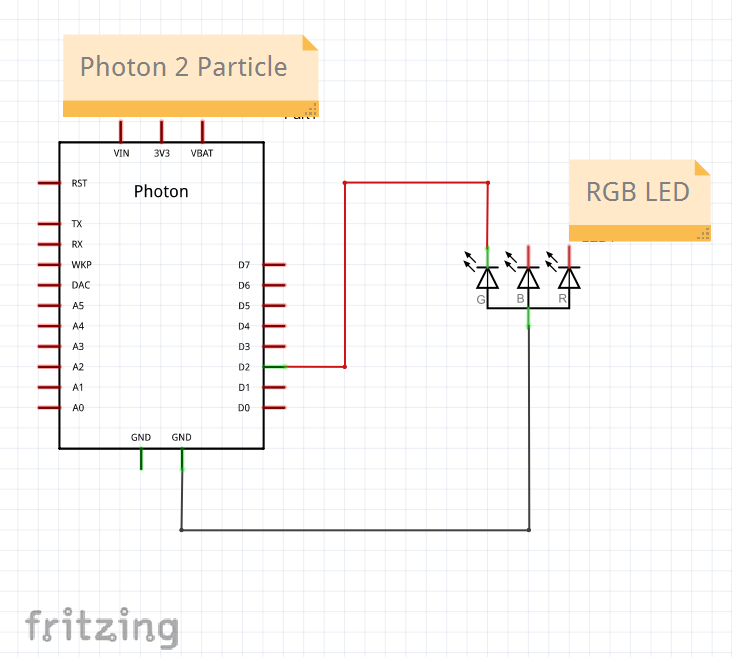
This project is designed to give fans in your house intelligence (in this project the fan is represented by an LED). If the temperature exceeds a set threshold this system will cause the fan to turn on. This will help to circulate the air in your room or house which will help the temperature to be more constant throughout, making for a much more comfortable living environment. This system also includes a button that can manually turn on the fan from anywhere as long as the circuits are connected to the internet. This system will also shorten the delay between checking the temperature reading while the fan is on so the fan is not on longer than necessary in order to save power which in turn saves you money.
ParticleCommunication
The image below is a flow chart of the communication between our three Photon 2 devices. The Photon in the middle represents the Photon that is connected to the RGB LED (the fan). This Photon subscribes to data from both the temperature sensor circuit and the button circuit, it then publishes its state which is subscribed to by the other two Photon devices.
DataCollection
The live data being published and subscribed to in the particle cloud for our project is simple because of the project setup. The graphs for the live data from the button and the temperature sensor can be seen below.
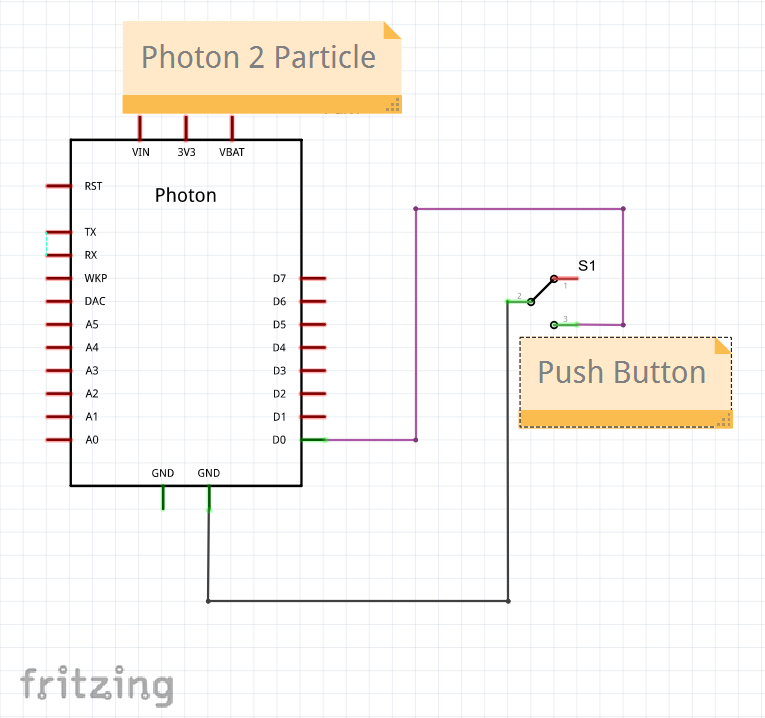
The live data the button outputs could be one of two outcomes, either a 1 or a 0. An output of 0 on the particle cloud for the button means that the button is not being pushed while an output of 1 represents the button being pushed. The peaks in the above graph show when the button has been pushed. These values are published to the cloud and are subscribed to by the RGB LED Photon 2 circuit to turn the LED on whenever the button is pushed and a value of 1 is output.
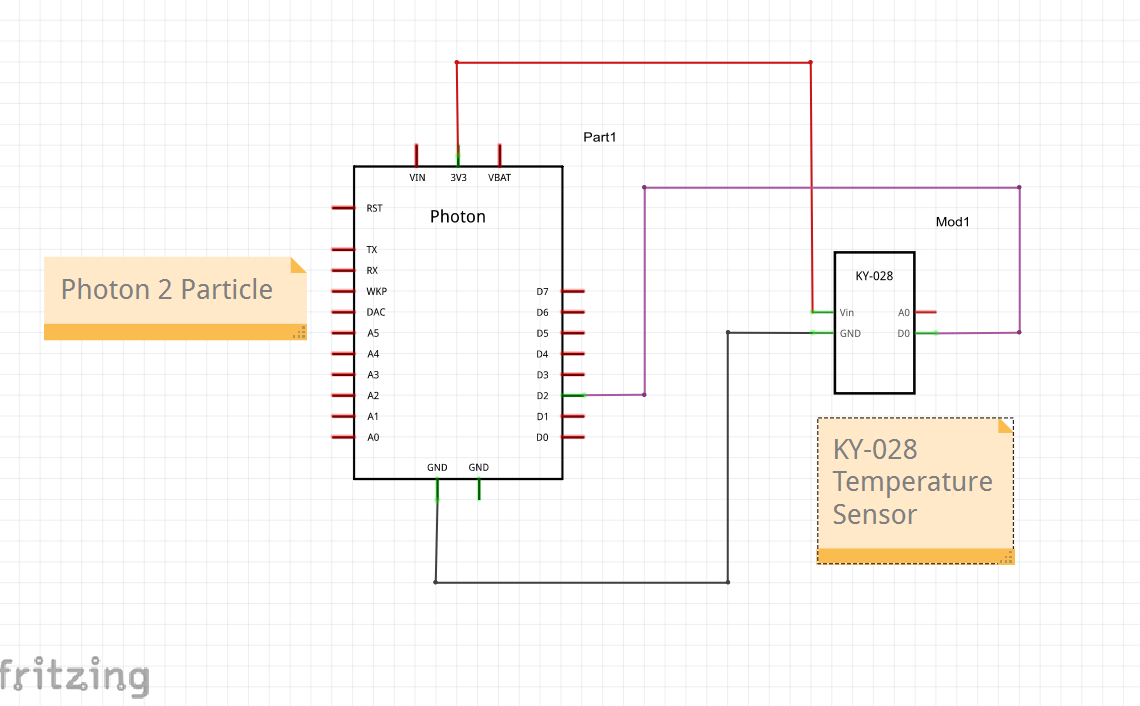
The live data from the temperature sensor has the same two outcomes as above, outputting either 1 or 0. However, for the temperature sensor, these values have different meanings. When the temperature sensor is outputting 1 the temperature threshold that is set on the sensor using the variable resistor has been exceeded, and when it is outputting 0 the threshold has not been met. This threshold is set using a potentiometer on the sensor. These values are then published to the cloud and the RGB LED subscribes to the data and turns on when the output value is reading 1. The RGB LED state is also published to the cloud and subscribed to by the temperature sensor so that the time between sensor readings is decreased when the LED is on.
ProjectVideo


Comments