

Hardware components | ||||||
 |
| × | 1 | |||
| × | 1 | ||||
| × | 1 | ||||
 |
| × | 1 | |||
 |
| × | 4 | |||
InqWeather is a simple web based weather station. It is part of an ongoing project used to teach Introductory Arduino, IoT and Web based programming techniques at our local public library and community college.
HardwareInqWeather hardware is very simple:
- 1 ESP8266 based NodeMCU or WeMos
- 1 Breadboard
- 1 BMP180 Temperature/Pressure sensor breakout, using I2C
- 1 AHT10 Temperature/Humidity sensor breakout, using I2C
- 4 Jumper wires
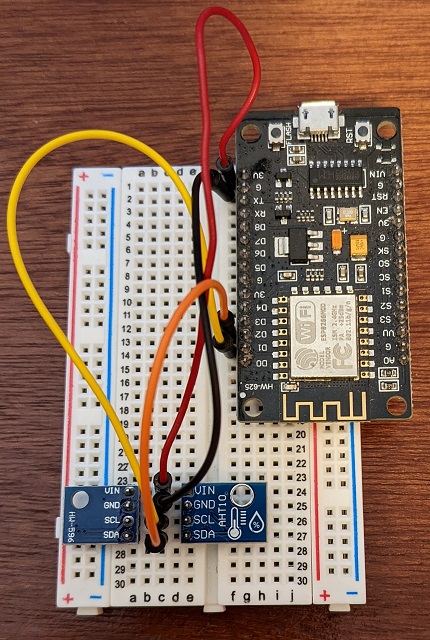
InqWeather Wiring
We take advantage of I2C being a multi-targeted serial communications bus. In other words, we can use just 4 wires to service both sensors. Note how the BMP180 and AHT10 board’s pins VIN, GND, SCL and SDA are on the same breadboard rows. In this way using just two data pins of our processor can query for the data of both sensors.
- Red wire – NodeMCU 3V pin to sensors’ VIN
- Black wire – NodeMCU G pin to sensors’ GND
- Yellow wire – NodeMCU D1 pin to sensors’ SCL
- Orange wire – NodeMCU D2 pin to sensors’ SDA
The new version (5.0) has grown some. The main source code sketch is still about 200 lines, fully commented. Only about thirty of these lines are to create the web server. The rest of the Sketch is standard handling of the sensors and project specific calculations. Some of the features of the code include:
- The InqPortal web server to expose the client UI, supply client-server communications and greatly reduce coding necessary to interact with the InqWeather. You’ll note there is no code doing explicit sends and receives. It is all being handled transparently so the developer can focus solely on the project at hand… a weather station!
- Demonstrates a persisted, published variable – altitude = a factor used to convert air pressure at your location to equivalent sea-level pressure that is reported by weather services. Also in version 5.0 we have added multiple client modifiable variables to support customizing the Zambretti weather prediction algorithm.
- Published read-only variables to disseminate current temperature, humidity, pressure Zambretti results. We wanted to have a more dynamic interface during testing and demonstration, so these variable are updated every second.
- Published read-only variables to disseminate a minute-by-minute temperature, humidity and pressure. These are an accumulated one minute average of all the 1 second readings. These are the ones that should be used as a weather station.
- Using a circular buffer to store 3 hours worth of pressure readings. These are used as one of the major inputs for the Zambretti weather prediction algorithm.
- You don't even have to type this in. When you download the InqPortal library from your Arduino IDE Library Manager, InqWeather is one of the examples.
- We now have a second file Zambretti.h to handle all the prediction calculations.
InqWeather has three different applications (web pages) for displaying results. These are mostly cosmetic and can be readily changed for cosmetics or functionality… obviously without having to recompile a thing. The following shows a list of files (web content) uploaded to the InqWeather/InqPortal server.
The Plain Digital web page is default web page – meaning that it will be the one called if no html file is defined after the URL address line on your browser. This is a standard web server default that actually uses the index.html.
- It displays two temperatures since both sensors supply a temperature. (one tiny next to the label) Normally, we might not use both, but in class, we want to demonstrate sensor manufacturing variability.
- The temperatures are modified from °C supplied by the server to °F here at the client. The index.js source code file makes the change. If you’re °C type of person, delete the obvious equation and you’ll get °C. This is an important concept where we intercept raw data supplied by the server and change it based on the context of the client user. In this example one observer of the InqWeather server may prefer °C, while another °F. Both can have their way and server does not have to bother with the details.
Analog Version ()
In this version we wanted to demonstrate using an off-the-shelf JavaScript library. During class, we pulled it off the Internet on a whim and slapped it in after about ten minutes of reading the website’s documentation. Give a shout-out for MykhaIloStadnyk, his library... and especially for his country.
Version 3 – PredictionInqWeather uses a circular buffer holding the pressure readings over the last three hour. It now uses these values to supply an important piece of information that the Zambretti algorithm needs for its predictive analysis. The Zambretti algorithm created in 1915, long before digital computers, takes atmospheric pressure and the change in the pressure over the last three hours to come up with 1 of 26 different weather predictions (A-Z). The InqWeather Sketch (the server) sends this value down to any clients whenever it changes. The client application (in this case the changing.js file) takes this value, does a look-up for the weather description and displays it. It also checks for an image with the same name (A.jpg, B.jpg... Z.jpg) and finds the closest available image to display as the background.
Programmatically, its main demonstration point is separation of concerns. The server supplies the Zambretti letter, but the client can display the results in different ways. All the descriptions can be changed from the original 1915 string to something more relatable here in the 21st century or into any language. Simply change the values in the changing.js file and upload it to the InqWeather server. The backgrounds can be changed (say... pictures out your front door of the weather conditions) by simply naming the picture to the desired condition. In the above example N.jpg and uploading it to the server. No code change is necessary. The client application will detect the available image and display it when appropriate.
100 Hour Test ResultsDuring the first 100 hours of testing, the server was being monitored by the InqPortal Admin. It has the ability to configure the History meter to track important System performance metrics as well as any of your numeric outputs. Here we have 100 hours worth of data showing temperatures from both the AHT10 and BMP180 and the Humidity and Sea-level normalized Barometric pressure. It also track the three hour change in pressure.
That’s it for now. InqWeather has been a great teaching / learning project. Let me know if you have any suggestions for future additions... especially if they can be used as a teaching moment for future students.


Comments